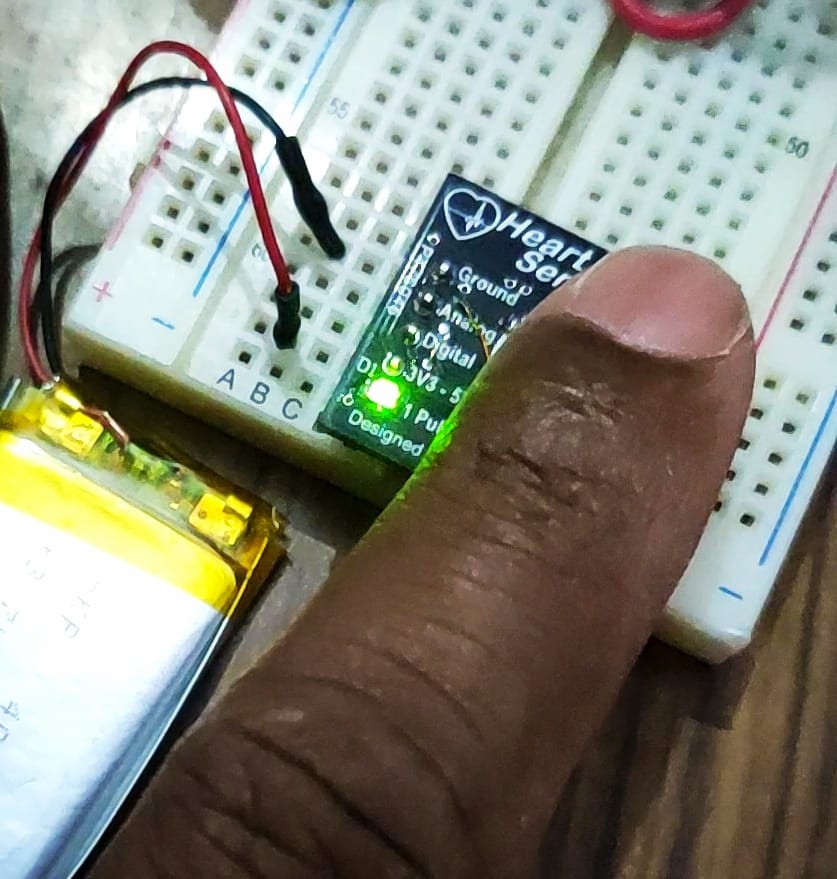
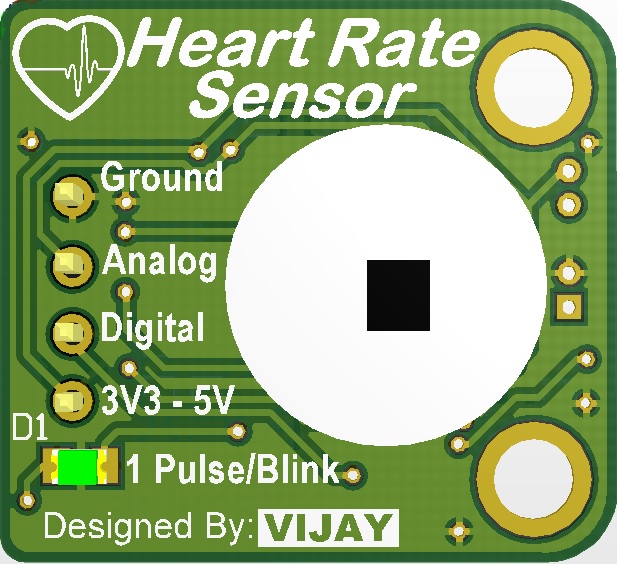
HBS201 is an IR-based Heartbeat sensor module. It is a non-invasive device. It detects the heartbeat by putting the fingertip on it. Its IR sensor is depicted in the image. This module is intended solely for educational and research purposes, NOT for medical use. It is shown in Figure 1.
Features:
- · Analog signal output
- · Digital pulse output
- · Breadboard mountable
- · LED indicator for each pulse
- · 3.3v to 5v power supply
- Application:
- Heartbeat Sensor
Sensor:
It is a transducer that converts variations in light into an electrical signal. An infrared (IR) based heartbeat sensor, also known as a photoplethysmogram (PPG) sensor. It is a device designed to measure an individual’s heartbeat (pulse rate) by detecting changes in blood volume in peripheral blood vessels. The basic principle behind these sensors is the absorption of light by haemoglobin in the blood. The function of the sensor is depicted in Figure 2
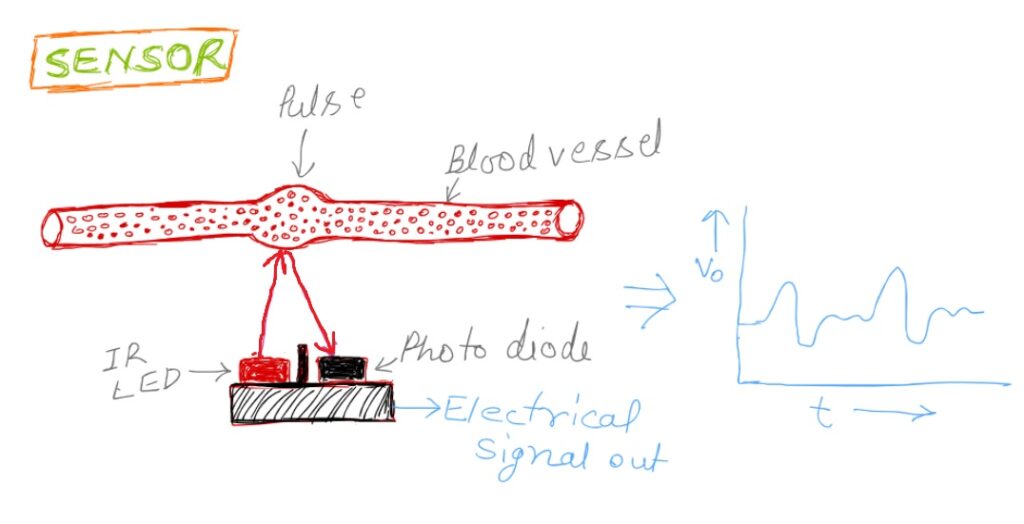
The sensor consists of two components. One is an IR light-emitting diode (LED), and the other is a photodiode or Phototransistor. Both are placed together, with the black divider separating them. A black divider stops the IR rays from reaching the photodiode directly.
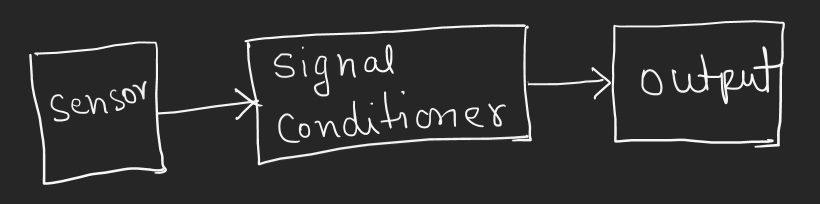
The IR LED emits the IR rays into the skin. When blood pulses through the vessels, the blood volume in them changes. With each heartbeat, more blood enters the area illuminated by the IR LED, increasing infrared light absorption. The intensity of the reflected light depends on the volume of blood. This reflected light incident on the photodiode, and the photodiode converts this intensity variation into an electrical signal. This signal is in the form of an Analog voltage. The amplitude of this signal is very low, and it is contaminated by unwanted noise. So, it is necessary to process this signal through a signal conditioner circuit. The Signal conditioner circuit amplifies the pulse signal and filters out unwanted noise. The block diagram of the sensor is shown in Figure 3
Output of the module:
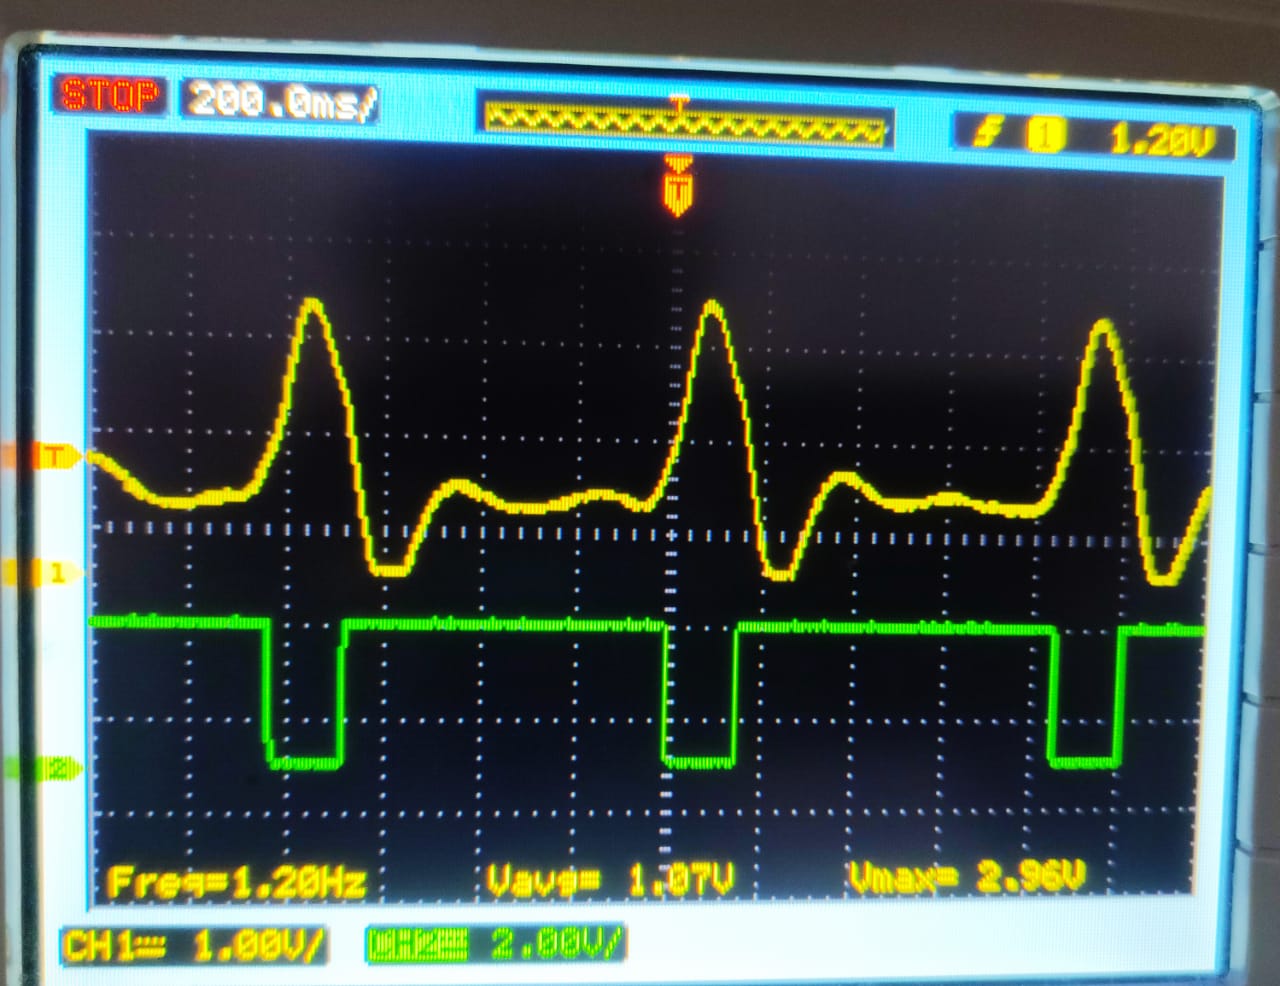
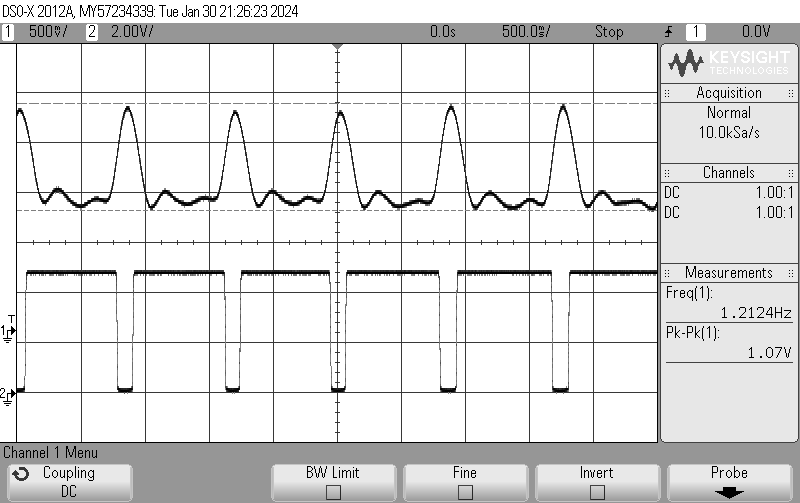
The amplitude of the output of the signal conditioner circuit is sufficient to be read by a Microcontroller or displayed on an Oscilloscope. Channel one displayed an analog signal, and channel two displayed a digital signal. Each pulse represents 0s. Shown in Figure. 4
Test conditions: Supply: 5V dc powered by an external supply source
Calculation of Pulses:
A Microcontroller or a digital pulse counter can count pulses within a predefined time interval and later calculate pulses per minute. It can also be achieved by finding the time between two successive pulses.
An LED is also mounted on the board and blinks with each pulse. One can manually count pulses per minute using this LED without other equipment.
Physical Dimension:
The PCB dimensions are 21mm x 23mm. There is a 4-way pin header. Pin’s name and function are depicted in Figure 5. The pitch of the connector pins is 2.54mm, which is compatible with the breadboard. So it can be easily mounted on the breadboard. There is an LED that blinks for each pulse. The module is also operated with a 3.7V lithium-ion battery.
Interface with Arduino Board:
The module can be interfaced with any Microcontroller. Interface steps and codes for the Arduino Uno board are given below.
The module has 4 pins as
- Ground
- Analog Signal Output
- Digital Signal Output
- Positive Power Supply (3V3 to 5V)
Connect the ground and power pin to the Arduino board. In this test, the power pin of the module has been connected to 5V of the Arduino board.
If you want to plot the Analog waveform, connect the Analog Output (Pin 2) of the module to any Analog pin of the Arduino board, i.e. A0, A1, A2, and so on. Upload the following code to the Arduino board. Here, the module’s analog output is connected to the A1 port of the Arduino Uno.
int analogInputPin = A1;   // select the input pin for the input analog signal
uint16_t analogValue=0;
void setup() {
  Serial.begin(9600);
}
void loop() {
analogValue = analogRead(analogInputPin); //read the analog signal from module
Serial.print(analogValue); // print the analog signal on serial monitor
delay(60);
}
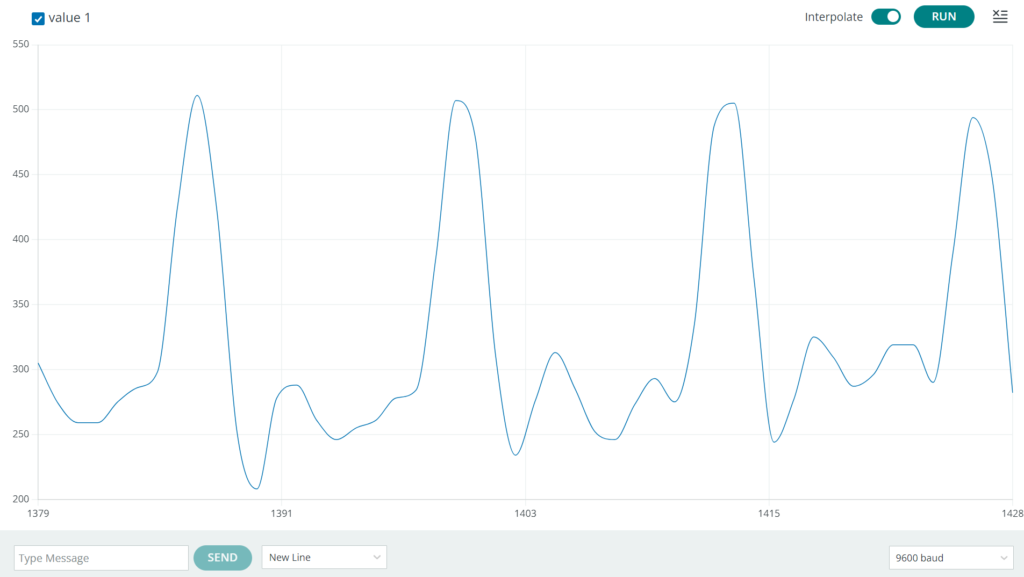
Now go to the tools tab in the Arduino IDE and select Serial Plotter. Check the baud rate. The baud rate should be the same as given in the code. Now, put the fingertip on the sensor of the module. You can see the analog output of the Pulse sensor module on the Arduino serial plotter window, as shown in Fig 6.
Output of the Analog waveform in serial plotter (baud rate: 9600).
Code to display both signals together in the Serial plotter window. Connect the Digital and analog output of the module to A0 and A1 of the Arduino, respectively.
int digitalInputPin = A0;   // select the input pin for the input digital signal
int analogInputPin = A1;   // select the input pin for the input analog signal
uint16_t analogValue=0;
uint16_t digitalValue=0;

void setup() {
  Serial.begin(9600);

}
void loop() {
  analogValue = analogRead(analogInputPin); //read the analog signal from module
  digitalValue = analogRead(digitalInputPin); //read the analog signal from module
  Serial.print(analogValue); // print the analog signal on serial monitor
  Serial.print(",");
  Serial.println(digitalValue); // print the analog signal on serial monitor
  delay(60);
}
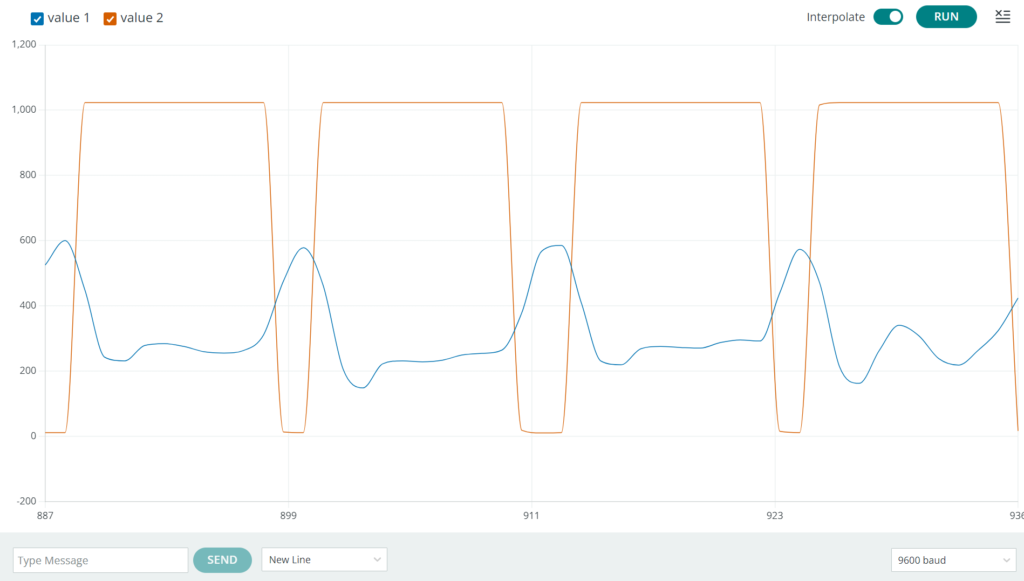
The output of both waveforms in the serial plotter is shown in Fig. 7
Pulse rate calculation with an analog signal. Read the time between successive peaks of the analog signal. The captured time is the Signal’s time period in milliseconds.
int analogInputPin = A1;   // select the input pin for the input analog signal
uint16_t analogValue=0;
uint16_t digitalValue=0;
double start=0;
double stop=0;
void setup() {
Serial.begin(9600);

}
void loop() {

  analogValue = analogRead(analogInputPin); //read the analog signal from module

  do{
    analogValue = analogRead(analogInputPin); //read the analog signal from module
  }while(analogValue<450);
  do{
    analogValue = analogRead(analogInputPin); //read the analog signal from module
    start=millis();
  }while(analogValue>449); //wait to detect peak
  do{
    analogValue = analogRead(analogInputPin); //read the analog signal from module
  }while(analogValue<450); // wait during the peak
  do{
    analogValue = analogRead(analogInputPin); //read the analog signal from module
    stop=millis();
  }while(analogValue>449); //wait for next peak
  //(stop-start) is time period in milliseconds between two consecutive peaks.
  int pulseRate = 60000/(stop-start); // Pulse rate is calculated per minute

  Serial.print("Pulse Rate : ");
  Serial.print(pulseRate); // print the calculated pulse Rate
  Serial.println("  bpm");
  //reset the time variables
  stop=0;
  start=0;
}
Pulse rate also can be calculated using Digital Signal. Connect the Digital Pin 3 of the module to the Arduino Digital Pin 2. Enable the external interrupt on the rising or falling edge of the digital signal and count these pulses per minute. Another way to capture the time stamp between two successive interrupts is to calculate the number of pulses per minute.
Code:
uint8_t interruptPin = 2;
double time=0;
double currentTime=0;
double lastTime=0;
int timePeriod=0;
void setup() {
  Serial.begin(9600);
  pinMode(interruptPin, INPUT_PULLUP);
  attachInterrupt(digitalPinToInterrupt(interruptPin), calculateTime, FALLING);

}
void loop() {

  //(stop-start) is time period in milliseconds between two consecutive peaks.
  if(timePeriod<1)
  {
  Serial.println("Finger Out .....");
  }
  else{
  int pulseRate = 60000/(timePeriod); // Pulse rate is calculated per minute
  timePeriod=0;
  Serial.print("Pulse Rate : ");
  Serial.print(pulseRate); // print the calculated pulse Rate
  Serial.println("  bpm");
  }
  delay(1000);

}
void calculateTime()
{
  currentTime=millis();
  timePeriod = currentTime-lastTime;
  lastTime=currentTime;
}
Output Video of the pulse calculation.